
Types of Charts: Which One to Use for Each Figure in a Report
Line, column, bar, pie, histogram or scatter? Match each report figure to the right chart type, build it in Excel or Google Sheets, and keep it readable.
- Excel
- Data Visualization
- Reporting Workflows
On this page
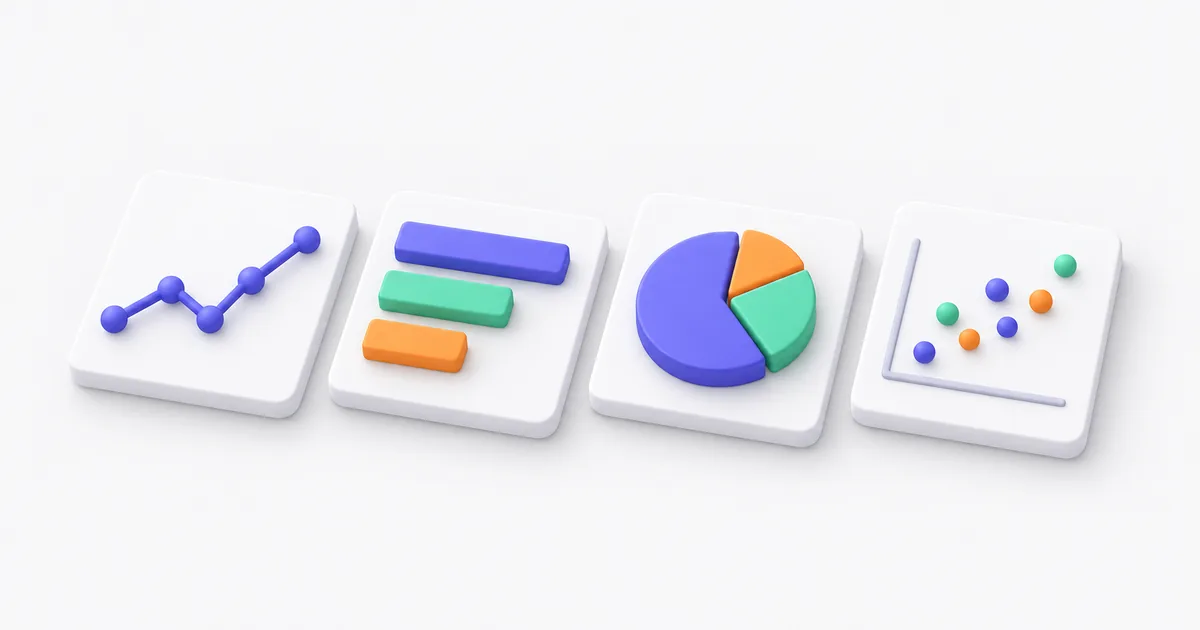
Excel offers more than a dozen chart types, and most monthly reports need four of them. The right one depends on the question the figure answers. A trend over months takes a line or a column chart. A ranking takes a bar chart. A share of a total takes a stacked bar, or a pie when there are only a few slices. A spread of values takes a histogram, and a link between two measures takes a scatter chart. This guide pairs each question with its chart, the Excel steps, and the mistake that makes it hard to read.
Which chart should you use for each type of data?
Start from the sentence the chart has to prove, then pick the chart that shows that kind of comparison. Time goes on a line or column chart, categories on a bar chart, parts of a whole on a stacked bar or a pie, spread on a histogram, and the link between two numbers on a scatter chart.
| Chart to use | Example in a monthly report | |
|---|---|---|
| Change over time | Line, or column for a few periods | Revenue for each of the last 12 months |
| Comparison | Bar, sorted from largest to smallest | Revenue by product or by sales rep |
| Part of a whole | Stacked bar, or pie with few slices | Share of revenue by sales channel |
| Distribution | Histogram | Number of orders by order value band |
| Relationship | Scatter | Ad spend against revenue for each campaign |
| Running total | Waterfall | How revenue went from last month to this one |
Microsoft's own guidance follows the same lines. Column charts show change over time or comparisons among items, bar charts suit long axis labels, and line charts show trends at equal intervals Microsoft Support. Google gives the same uses for the charts in Sheets Google Docs Editors Help.
When do you use a line chart or a column chart?
Use a line chart when the points follow each other in time and you care about the direction. Use a column chart when there are few periods, or when each period is a total you want to compare as a block. Twelve months of revenue reads well as a line. Four quarters reads well as columns.
A line joins the points, so it tells the reader that the values in between exist. That works for months and weeks. It fails for categories such as products, where a line from one product to the next means nothing. Two or three lines on one chart are fine. Past five, the lines cross and the reader stops following any of them.
A line chart can start its vertical axis above zero, because the reader judges the slope, not the height. A column chart cannot. Datawrapper refuses a column or bar axis that starts above zero, because the bar lengths then exaggerate the differences Datawrapper Academy. Excel sometimes picks a minimum above zero on its own. Check it under Format AxisAxis OptionsBoundsMinimum and set it to 0 for columns.
When is a bar chart better than a pie chart?
Almost always when you compare more than three or four items. A sorted bar chart shows the ranking at a glance, while slices of similar size look alike. Keep a pie for a single total split into a few slices, such as two or three sales channels.
Microsoft recommends a pie only for one data series with no negative values and no more than seven categories Microsoft Support. Datawrapper sets the limit at five and says pies work best for shares near 25%, 50% or 75%. To compare shares, it suggests a bar or column chart instead Datawrapper.
Sort the bars from largest to smallest, unless the categories have a natural order such as age bands or months. Use horizontal bars when the labels are long, such as product names, so they stay readable without tilting. To compare the split across months, use a 100% stacked column chart: one column per month, each split by channel.
How do you show how values are spread?
Use a histogram. It groups values into bands, such as orders of 0 to 50, 50 to 100 and so on, and shows how many fall in each band. An average hides whether most orders are small with a few large ones, and a histogram shows it.
In Excel 2016 and later, select the column of values and choose InsertInsert Statistic ChartHistogram. Excel picks the bands. Right-click the horizontal axis, choose , and set the bin width under to a round number your readers will recognize Microsoft Support. Google Sheets has a histogram chart too, which shows the distribution of a data set across buckets Google Docs Editors Help.
For a link between two measures, such as ad spend and revenue per campaign, use a scatter chart. Each campaign becomes a dot, and a cloud that rises from left to right shows that the two move together. It shows a link, not a cause.
How do you make a chart in Excel?
Select the data with its headers, then choose InsertRecommended Charts. Excel suggests charts that fit the data, and lists every type Microsoft Support. Recommended Charts is in Microsoft 365. Older versions use the chart buttons in the InsertCharts group.
The data shape decides most of the result. Put dates or categories in the first column and one measure per column after it. If the data is a raw export with one row per order, summarize it first. A pivot table grouped by month gives the 12 rows a revenue chart needs, as shown in how to create a pivot table and group it by month. Clean the dates and numbers before you chart them, or a text date turns into a category of its own (how to clean data in Excel).
In Google Sheets, select the data and choose InsertChart. The chart editor opens on the side, and you change the type under SetupChart type Google Docs Editors Help.
What makes a report chart easy to read?
One message per chart, said in the title. "Revenue rose 8% in March" tells the reader what to see, while "Revenue by month" leaves them to find it. After that, remove whatever does not help that message.
A short checklist before a chart goes in the report:
- The title states the finding. The axis titles carry the units.
- Bars and columns start at zero. Lines may start higher.
- Bars are sorted, unless the order is time or a natural sequence.
- Labels sit on the data when there are few series, instead of a legend the reader has to match by color.
- No 3D effects. They distort the sizes the reader compares.
- One vertical axis. Two vertical axes with different scales let you suggest any link you like. Use two charts side by side instead.
- The same thing keeps the same color across every chart in the report, so "online" is always the same color.
Where does Glow Reports fit?
The rules above work in Excel and Google Sheets, and a chart you build once is quick there. Glow Reports helps when the report needs a dozen charts built from raw exports every month.
You upload one or several CSV or Excel files and ask for the report in plain language, such as revenue by month and by channel. The AI writes the SQL, picks and builds the charts, and drafts the text around them. The SQL sits under each figure, so you can check what a chart sums and edit the query when it groups the wrong column. Reports export to PDF and stay in the workspace. The free plan gives 300 credits once, and a report costs 100 credits.
Common questions
What are the main types of charts?
Line, column, bar, pie, area, scatter, histogram and waterfall cover most business reports. Excel also offers combo, treemap, funnel and map charts for narrower uses.
What chart is best for showing change over time?
A line chart for many periods, such as 12 or more months, and a column chart for a few periods, such as four quarters. Put time on the horizontal axis, from left to right.
How many slices should a pie chart have?
Five at most, by Datawrapper's guidance, and never more than seven, by Microsoft's. Past that, use a bar chart sorted from largest to smallest.
Should a chart axis always start at zero?
For bar and column charts, yes, because the reader compares the lengths. A line chart may start higher, since the reader follows the slope, as long as the axis labels make the starting value clear.
I am a product engineer and the founder of Glow Reports. I spent more than 6 years building products in tech, data and cybersecurity, for large groups, startups and SMEs. In most organizations I saw data treated as a technical topic, when it drives business decisions. I built the reporting tool I was looking for, so the people who run small and mid-sized organizations can read their own numbers without a data team.
More from El Mehdi BenaneUpload your exports to Glow Reports and ask for the report. The AI builds the charts, with the SQL under each one.
Keep reading
 Ad Hoc Reporting Requests: How to Cut the Queue So Business Teams Answer Their Own QuestionsEl Mehdi Benane, 4 min read
 How to Calculate Days Between Two Dates in Excel, and Fix DATEDIF #NUM!El Mehdi Benane, 4 min read
 XLOOKUP vs VLOOKUP vs INDEX MATCH: Which One to Use on Your ExportsEl Mehdi Benane, 4 min read