Latest Articles

Business Intelligence and Analytics Insights

Research-backed articles on analytics, reporting and marketing for small and mid-sized teams.

A laptop screen showing a user typing a question and receiving a polished PDF report instantly
Product WalkthroughAI ReportingEfficiency

From Raw Data to Board-Ready Report in 3 Minutes: An AI Reporting Walkthrough

Manual reporting takes hours of exports and formatting. See how to go from raw data to a board-ready report in 3 minutes with Glow Reports.


Glow Reports Team's profile image
Glow Reports Team2 min read
Multiple data streams converging into one unified dashboard with aligned metrics
Data StrategyStartup OperationsData Trust

Building a Single Source of Truth for Startup Data (Without a Warehouse)

When finance, sales, and founders see different numbers, decisions stall. Build a single source of truth for startup data with Glow Reports.

Glow Reports Team's profile image
Glow Reports Team2 min read
Profit and loss report highlighting the gap between revenue and real margin
Unit EconomicsFinanceProfitability

7 Profitability Reporting Mistakes That Quietly Drain Your Budget

Revenue is growing but cash is not. Avoid the 7 profitability reporting mistakes that drain budgets and track true margin with Glow Reports.

Glow Reports Team's profile image
Glow Reports Team2 min read
Simple infographic showing raw data flowing into clear business insights
Business IntelligenceFounders GuideData Strategy

What Is Business Intelligence, Really? A Plain-English Guide for Founders

Business intelligence is more than dashboards: it turns raw data into decisions. A plain-English guide for founders from Glow Reports.

Glow Reports Team's profile image
Glow Reports Team2 min read
HubSpot and Stripe logos connected by a unified data line merging into a single dashboard
RevOpsData IntegrationSaaS Finance

Connecting Your CRM and Billing Data: A Practical Guide for RevOps

HubSpot and Stripe disagree on revenue more often than not. A practical RevOps guide to connecting CRM and billing data with Glow Reports.

Glow Reports Team's profile image
Glow Reports Team2 min read
Non-technical user asking questions on a laptop and receiving instant chart visualisations
No-CodeData AnalyticsSME Growth

No-Code Data Analytics: Get Insights Without Hiring a Data Team

No-code data analytics gives SMEs insights without SQL or a data team. See how Glow Reports lets anyone self-serve answers in plain English.

Glow Reports Team's profile image
Glow Reports Team2 min read
Side-by-side comparison of complex enterprise dashboard and simple AI-generated report
BI ToolsProduct ComparisonSaaS

Power BI vs. an AI Reporting Tool: Which Is Right for a Non-Technical Team?

Power BI demands DAX skills and months of setup. Compare it to an AI reporting tool and see how Glow Reports fits non-technical teams.

Glow Reports Team's profile image
Glow Reports Team2 min read
A comparison chart resolving conflicting revenue numbers into a clear, unified metric
SaaS MetricsFinanceRevenue Operations

How to Calculate Real MRR and Churn (When Stripe and HubSpot Disagree)

Stripe and HubSpot rarely agree on MRR and churn. Learn how to calculate real SaaS metrics and how Glow Reports applies one logic to both.

Glow Reports Team's profile image
Glow Reports Team2 min read
A messy spreadsheet transitioning into a clean, automated digital report
AutomationReporting WorkflowsProductivity

Stop Doing Monthly Reports in Excel: A No-Spreadsheet Workflow for SMEs

Manual CSV exports and broken formulas cost your team hours every month. Learn how to automate reporting and let Glow Reports replace the spreadsheet.

Glow Reports Team's profile image
Glow Reports Team2 min read
Meta Ads and Google Ads dashboards showing reporting gaps and attribution errors
Meta AdsGoogle AdsPaid Acquisition+2

7 Ads Reporting Mistakes That Are Draining Your Budget (And How to Fix Them)

Platform ROAS, last-click attribution, and one-off exports give you a broken picture of your ad performance. Avoid these 7 mistakes and let Glow Reports connect your spend to real revenue.

Glow Reports Team's profile image
Glow Reports Team2 min read
GA4 and BigQuery schema diagram showing event and parameter structure
Google AnalyticsBigQueryAnalytics Engineering+2

Designing a GA4 Implementation That Holds Up in BigQuery

Move beyond default GA4 tags. Design a clean event model, align it with BigQuery export, and connect GA4 to real revenue data with Glow Reports.

Glow Reports Team's profile image
Glow Reports Team2 min read
Abstract representation of disconnected data streams merging into a single dashboard
Data ManagementSaaS MetricsOperations

SaaS Data Silos: Why Your Numbers Never Match (and How to Fix It)

Your billing, CRM, and marketing tools all show different numbers. Learn why SaaS data silos happen and how Glow Reports builds one source of truth.

Glow Reports Team's profile image
Glow Reports Team2 min read
Shopify dashboard showing common reporting mistakes and how to fix them
Shopify AnalyticsEcommerceProfit Analysis+3

7 Shopify Reporting Mistakes That Are Hiding Your Profit (And How to Fix Them)

Your Shopify dashboard shows revenue but hides profit. Avoid these 7 common Shopify reporting mistakes and learn how Glow Reports gives you clean, recurring profit reports.

Glow Reports Team's profile image
Glow Reports Team2 min read
Stripe subscription metrics diagram showing MRR and churn components
StripeSaaS MetricsMRR+2

Standardizing Stripe MRR and Churn for Reliable SaaS Reporting

Stripe processes payments, but SaaS metrics need consistent definitions. Learn how to model MRR, churn, and NRR on top of Stripe and automate reporting with Glow Reports.

Glow Reports Team's profile image
Glow Reports Team2 min read
Stripe dashboard with MRR and churn reporting errors highlighted
StripeSaaSSubscription Reporting+1

7 Stripe Reporting Mistakes That Are Breaking Your Board Deck (And How to Fix Them)

MRR spreadsheets, inconsistent churn definitions, and manual Stripe exports slow down every board meeting. Avoid these 7 mistakes and let Glow Reports automate your subscription reporting.

Glow Reports Team's profile image
Glow Reports Team2 min read
GA4 dashboard showing common mistakes and how to fix them
Google AnalyticsAnalyticsData Analysis+2

7 GA4 Mistakes That Are Killing Your Reporting (And How to Fix Them)

Struggling with GA4 data you don’t trust? Avoid these 7 common Google Analytics 4 mistakes and learn how Glow Reports cleans up your reporting.

Glow Reports Team's profile image
Glow Reports Team2 min read
HubSpot CRM pipeline view showing common reporting gaps and fixes
HubSpotCRMPipeline Reporting+2

7 HubSpot Reporting Mistakes That Are Slowing Your Pipeline (And How to Fix Them)

Manual exports, single pipelines, and missing cycle time data make HubSpot reporting unreliable. Avoid these 7 mistakes and let Glow Reports turn your CRM data into a clear, recurring revenue report.

Glow Reports Team's profile image
Glow Reports Team2 min read
Featured image for Reporting Tool vs Excel: When It's Time to Upgrade (and What to Look For in 2026)
Tips

Reporting Tool vs Excel: When It's Time to Upgrade (and What to Look For in 2026)

Manual Excel reporting costs your team $10k+/analyst/year. Learn when to upgrade, what to look for, and how to pick the right reporting tool in 2026.

Glow reports's profile image
Glow reports10 min read
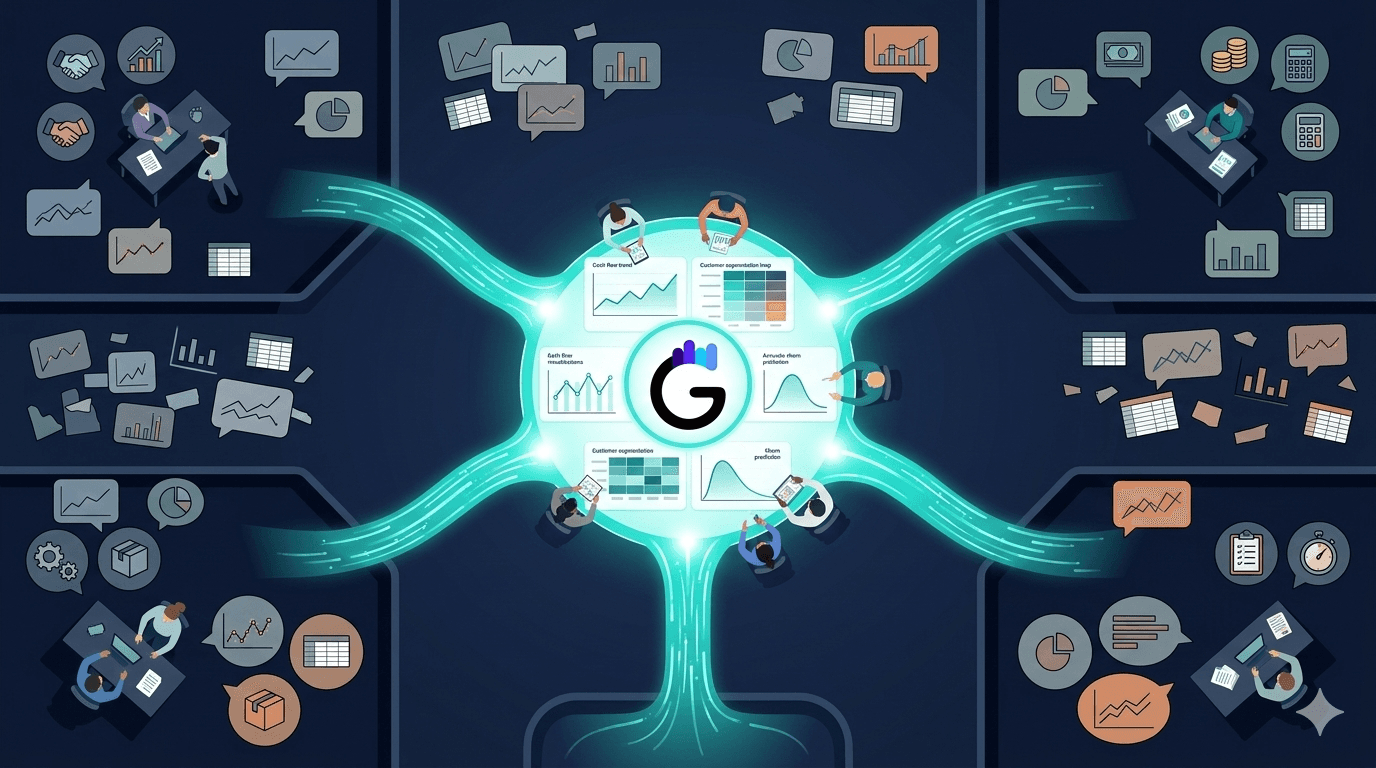
AI-powered finance dashboard showing automated variance analysis and predictive forecasts
AIFinanceData Analysis+2

AI for Data Analysis: 7 Real Use Cases Finance Teams Can Implement This Quarter

AI for finance isn't hype anymore. Discover 7 real use cases (variance analysis, churn prediction, forecasting...) your team can implement this quarter.
Glow Reports Team's profile image
Glow Reports Team7 min read
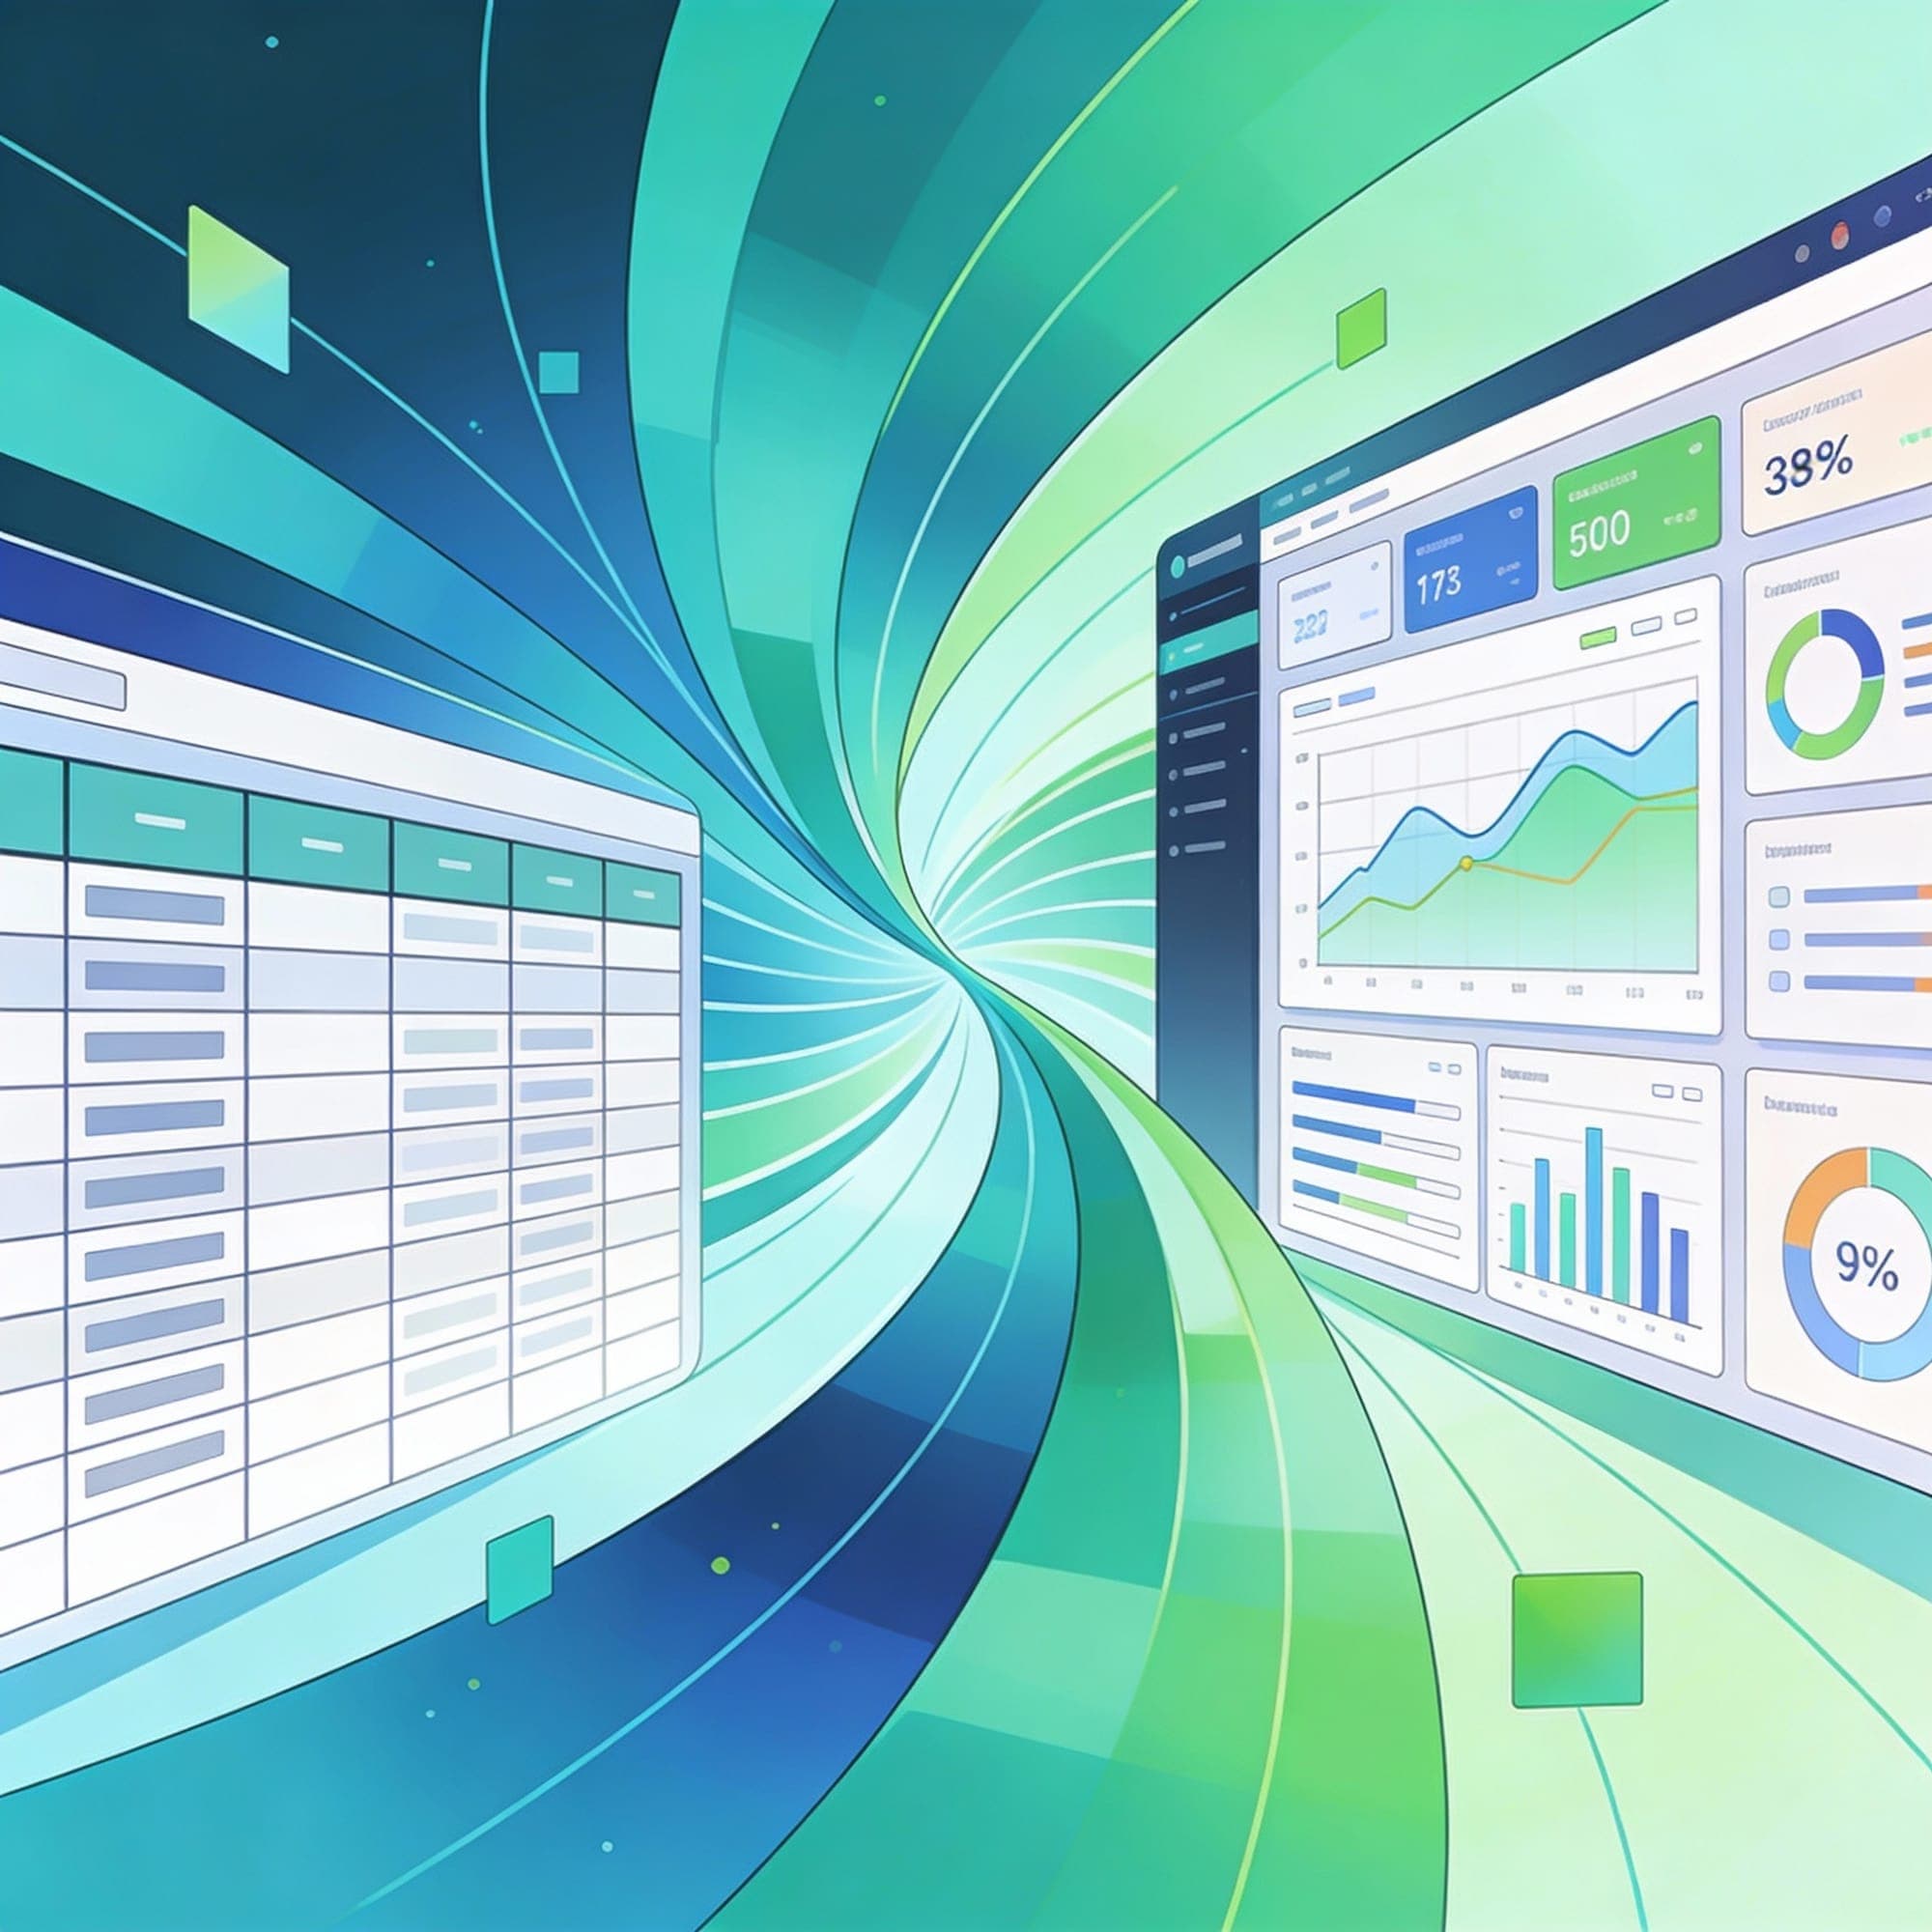
Dashboard showing unified analytics solving data silo problems in a growing company
AnalyticsBusiness IntelligenceData Strategy+1

From Scattered Reports to a Single Source of Truth: Fixing the 5 Biggest Analytics Problems

Learn why 75% of BI investments fail and how to fix the five biggest analytics problems in growing companies, from data silos to low adoption, without buying new software.
Glow Reports Team's profile image
Glow Reports Team9 min read
Featured image for From Spreadsheets to Stunning Reports: Why Excel Dashboards Don't Scale (And What to Do About It)
Insights

From Spreadsheets to Stunning Reports: Why Excel Dashboards Don't Scale (And What to Do About It)

 75% of enterprises report Excel limitations in enterprise scalability. For teams struggling to transform data into polished PDF reports and share them reliably, the problem isn't just inefficiency, it's that Excel was never designed for this job.

Glow reports's profile image
Glow reports8 min read
Featured image for Announcing Glow Reports v1: Making Data-Driven Decisions Accessible to Everyone
News

Announcing Glow Reports v1: Making Data-Driven Decisions Accessible to Everyone

We're excited to unveil Glow Reports v1; a complete reimagining of how everyone, technical and non-technical alike, can work with data.

Glow reports's profile image
Glow reports5 min read
Featured image for From Quick Queries to Comprehensive Insights: Why Traditional LLMs Fall Short for Enterprise Data Analysis
Tech

From Quick Queries to Comprehensive Insights: Why Traditional LLMs Fall Short for Enterprise Data Analysis

Uploading your CSV to ChatGPT seems revolutionary until you hit reality: your data becomes training material, millions of rows get truncated, and automation becomes impossible. Discover why LLMs fail at enterprise data work, and how Glow Reports delivers unlimited processing and automated insights.

Glow reports's profile image
Glow reports9 min read
Featured image for Cracking the Crowdfunding Code: What $109 Million in Kickstarter Data Reveals About Building Winning Campaigns in 2025
Report

Cracking the Crowdfunding Code: What $109 Million in Kickstarter Data Reveals About Building Winning Campaigns in 2025

One company raised $20 M on Kickstarter—three times. While 85% of projects cluster in the US, Germany’s 83 M consumers account for < 1% of campaigns. Our $109 M data analysis reveals the hidden patterns separating viral successes from failures.
Glow reports's profile image
Glow reports6 min read
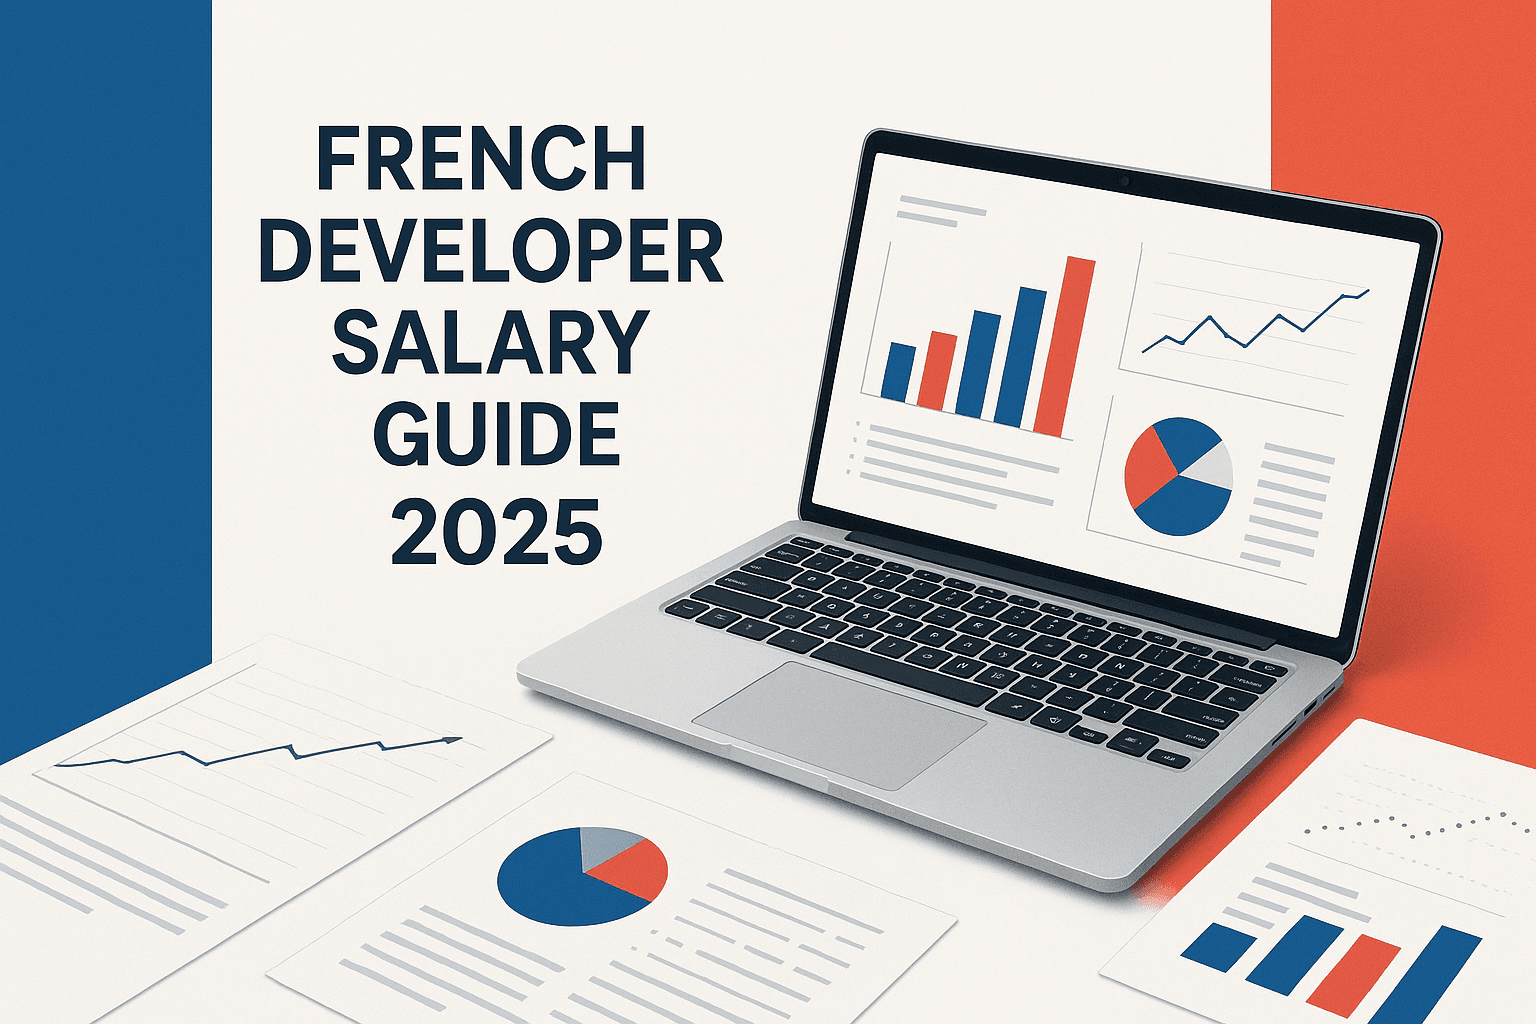
Featured image for The Complete Guide to Developer Compensation in France 2025: Strategic Insights for Competitive Hiring
Report

The Complete Guide to Developer Compensation in France 2025: Strategic Insights for Competitive Hiring

The French tech landscape has never been more dynamic, with over 500,000 tech jobs available and a projected market value of €70 billion by 2025. This comprehensive analysis reveals the current state of developer salaries in France...

Glow reports's profile image
Glow reports8 min read